
How to Create Business Indicators that Make Sense

Metrics continue to be a great topic of conversation in organizations - and rightly so. With the current wave of marketing on Big Data, BI (Business Intelligence), SaaS (Software as a Service) these themes all leverage METRICS as a trigger to gain CEOs’ attention.
Metrics is certainly not a new buzz word, as we have all heard the most famous expressions:
 You can’t manage what you don't measure" by Drucker
or
Carpentry proverb "Measure twice cut once"
These axioms endure because they represent key principles of business, but on many occasions their familiarity is mistaken or overly simplified for what leaders and executives must do. Metrics are part of the process to assess performance and use data to determine actions that will enable them to prioritize issues, solve problems and make decisions that affect performance.
This all sounds well and good on paper, but we see much confusion and redundancy when companies share their thinking and approach to metrics. Here are 3 major gaps and 3 simple solutions to clear the metric air of confusion in your organization.
The three gaps include:
1. No clear definition or format for metrics – Simply talking “metrics” conjures up competence. But in reality metrics (or the gauge, calibration, parameter) is only 1 small part in defining performance indicators. There are 3 missing pieces - defined later in this article. The takeaway is that metrics are a good placeholder work, but you have to define what they are in your company.
2. Too many metrics – I see pages and pages of reports in companies that look good and employ the right software or dashboard, but when asked how they are being used, there is no clear consensus. This is unfortunate as collecting data on metrics takes resources - time, money and people- and if they are not being used to drive problem solving and decision making, it's a real waste of valuable assets.
3. No distinction between Strategic and Operational Performance Metrics – Every time I see Key Performance Indicators - a catchy catchall – I cringe, because in many cases, this is a company’s long list that contains both Strategic and Operational metrics that are all mixed up. Meaning they are valuable pieces of information or “things” being measured, but there is no systematic way that the company fits them together. Many times, these mixed KPIs can cannibalize one another. One functional indicator drives new product launches at the expense of a strategic profitability indicator or the number (#) of sales call per day are at odds with the # of key customer sales calls that should be happening. KPIs need to be distinguished between the WHAT (strategy) and HOW (operations) of a business.
Importantly, these counter facing metric gaps are critical to fix, because it’s likely your compensation programs align themselves with some sort of KPIs and if those don’t make strategic sense, supported by aligned operational capabilities that are being measured – you create confusion in your organization about what performance should be measure.
So what to do….
Here are Three – Powerful, Yet Simple Steps To Clarify Metrics – or Better Stated – Performance Indicators
1. Do away with the Lexicon of KPIs
KPIs are ambiguous – what is KEY? If you delve into this, it will surely be some mix of strategy and operational factors. Instead, separate KEY into STRATEGIC (WHAT) the business measures and OPERATIONAL (HOW) is accomplishes this. More on this in point 3.
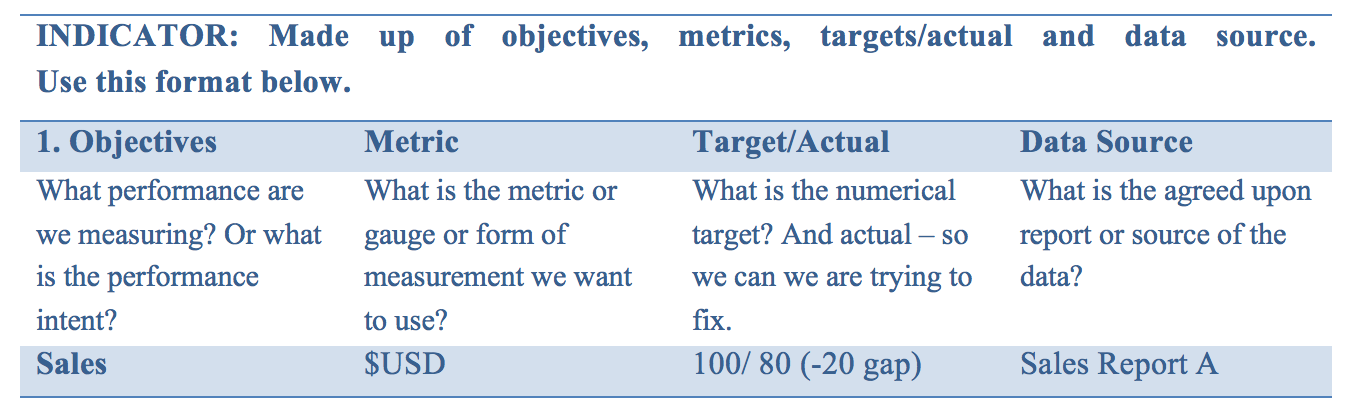
2. Ensure You can Check off These 4 Points for Any Indicator
Try this format out – and you will most likely see that there may not even be clear definitions or agreement on each of these 4 points – and that's okay – but you need to clarity them – because that is what is causing the disconnects.
3. Separate Indicators into Strategic and Operational or (SPIs) and (OPIs)
Strategic indicators should be key data points that give your executive team and organization feedback that their strategy is working as envisioned. We know that strategies don’t work as expected and that is why you need to have Strategic Performance indicators or specific feedback points that can indicate what is working and not working. Every company should really have no more than 8 SPIs that they monitor quarterly. SPIs should be created from the fundamental decision points behind the purpose and path for your company including: Products (services), Markets (Geographies, Channels, Customers) and Capabilities (processes and competencies) you made when setting your strategy.
You should consider no more than two Indicators per each of the four categories (note: examples are provided in each bullet point)
1. Financial (LAGGING)
- Revenue
- Net Income
2. Customer (LAGGING)
- Key Product Segments
- Key Market Segments Sales/Penetration/Profit Volume
3. Process (LEADING)– the key capacities that drive growth and advantage
- # of new product launches
- # of Quality Issues
4. People (LEADING)
- Individual Performance Objectives
- Alignment to Values/Basic Beliefs
In summary, data is critical for decision making and metrics form a key point of feedback that must be clarified and simplified to make organizations stronger. But the “buzz” around metrics needs to be sorted or you may be “managing the wrong thing you are measuring” or cutting the wrong thing you measured twice.
Tim Lewko is CEO of Thinking Dimensions, a professional services firm with offices in 16 countries that advises clients on the big decisions relevant to their future success. If you would like to comment or learn more feel free to visit the company blog where there are more than 80 topics discussed as well as complimentary white papers and interesting downloads.